Image Details
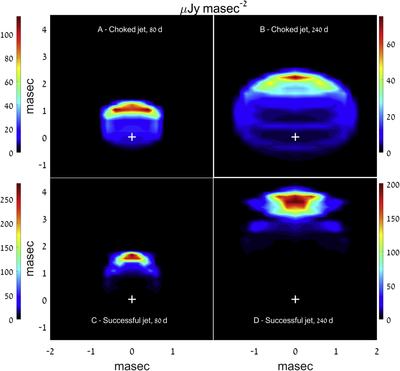
Caption: Figure 5.
Radio images at 3 GHz for two of the simulations presented in Figure 3, the uncollimated choked jet with high density and the successful jet. The images are taken on day 80 (panels (a) and (c)) and day 240 (panels (b) and (d)), where the light curves of both afterglows peak. The plus signs at [0, 0] mark the line of sight. Both models show a roughly linear growth of the image size with time, to a size that should be resolved by the very long baseline interferometry (VLBI). By day 80 the jet is already the main contributor in the successful jet model, whereas the wider cocoon leads to a bigger image in case of a choked jet. By day 240 both shapes remain similar but have grown bigger over time, with the successful jet showing a more symmetric image with a centroid that is at a larger offset compared to the image on day 80. This is a general feature of successful jet images near the peak of the radio light curve, when the peak is dominated by the jet emission. We note that the image of the choked jet in this example is not general, and in other simulations (that fit the radio light curve) we see different image structures. The common property of most choked jet images is that they are asymmetric, with one axis of the image being longer than the other.
Other Images in This Article
Copyright and Terms & Conditions
© 2018. The American Astronomical Society. All rights reserved.