Image Details
Caption: Figure 1.
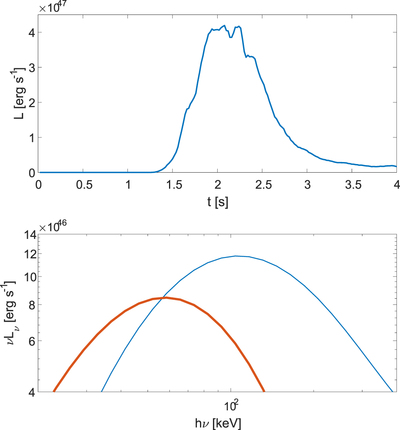
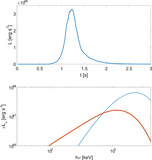
The γ-ray light curve (top panel) and spectrum (bottom panel) during the shock breakout from the uncollimated choked jet simulation describe in the Appendix. The spectrum is divided into the emission during the peak (blue line) and that during the tail (red line). The jet opening angle is 0.7 rad, and it is fully choked long before the shock driven by the cocoon breaks out of the ejecta fast tail. The observer is at an angle of 0.6 rad. The γ-ray signal shows the main properties of GRB 170817A (Goldstein et al. 2017). It starts rising about 1.5 s after the merger, having a peak that lasts about 0.5 s, followed by a longer decay that lasts an additional second. The peak luminosity is comparable to that of GRB 170817A to within an order of magnitude (about a factor of 3 brighter). The spectrum shows a hard-to-soft evolution where the peak of νFν is Ep ≈ 110 keV during the initial pulse (integrated up to 2.3 s) and Ep ≈ 55 keV during the tail (after 2.3 s). This should be compared to GRB 170817A, where in the initial pulse ﹩{E}_{p}=185\pm 62\,\mathrm{keV}﹩ and the tail’s spectrum is consistent with a blackbody with T ≈ 10 keV, where Ep ≈ 40 keV.
Other Images in This Article
Copyright and Terms & Conditions
© 2018. The American Astronomical Society. All rights reserved.