Image Details
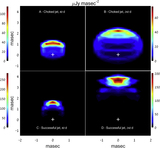
Caption: Figure 2.
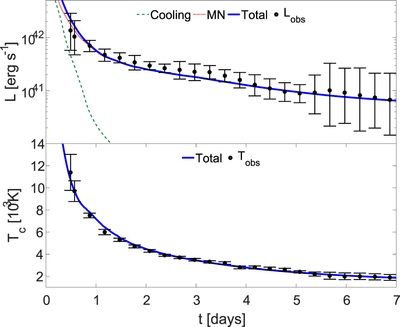
Optical light curve (top panel) and color temperature (bottom panel) from an uncollimated choked jet simulation (the same simulation and same observing angle as in Figure 1); see the Appendix for details. The data are taken from Kasliwal et al. (2017). Here we show the fit for a two-component ejecta, where the opacity of slow-moving material (<0.1c; mostly ejected along the equator) is ﹩5\,{\mathrm{cm}}^{2}\,{{\rm{g}}}^{-1}﹩, corresponding to a lanthanides-rich material, while that of fast-moving material is ﹩0.8\,{\mathrm{cm}}^{2}\,{{\rm{g}}}^{-1}﹩, consistent with the expectation for a lanthanides-poor material. A fit with a similar quality is obtained for a single lanthanides-poor component outflow with a constant opacity of ﹩0.8\,{\mathrm{cm}}^{2}\,{{\rm{g}}}^{-1}﹩. The contributions of the two power sources are shown: the cocoon cooling emission (dashed line) and the radioactive macronova (dotted line). The cocoon macronova emission is significant during the first day, after which the ejecta macronova dominates the emission.
Other Images in This Article
Copyright and Terms & Conditions
© 2018. The American Astronomical Society. All rights reserved.