Image Details
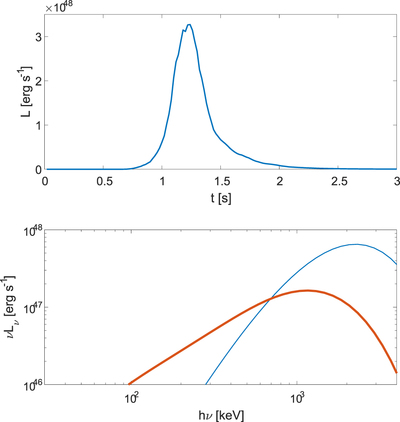
Caption: Figure 4.
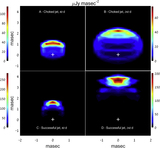
Shock breakout γ-ray light curve (top panel) and spectrum (bottom panel) from the successful jet simulation. The blue thin line is the spectrum during the peak, while the red thick line is the spectrum during the tail.
Other Images in This Article
Copyright and Terms & Conditions
© 2018. The American Astronomical Society. All rights reserved.
Copyright ©
2025 Astronomy Image Explorer. All Rights Reserved.