Image Details
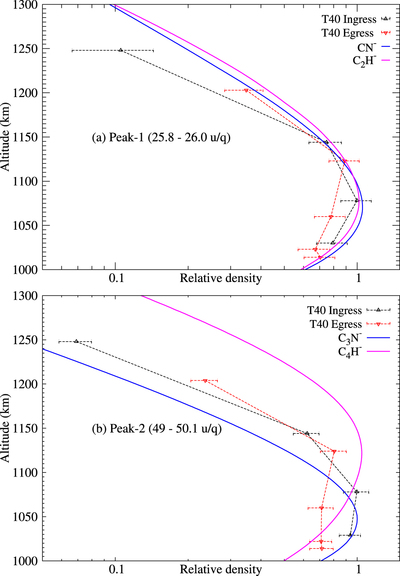
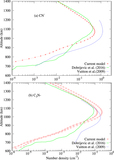
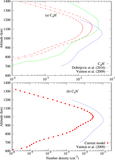
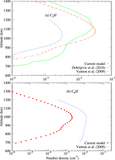
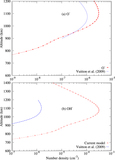
Caption: Figure 9.
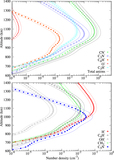
Relative model density profiles of the anions CN−, C2H− (top panel), and C3N− and C4H− (bottom panel) compared with the profiles obtained by Desai et al. (2017) at the mass peaks 25.8–26.0 m/q and 49–50.1 m/q during the ingress and egress of the T40 flyby.
Other Images in This Article
Copyright and Terms & Conditions
© 2018. The American Astronomical Society. All rights reserved.
Copyright ©
2025 Astronomy Image Explorer. All Rights Reserved.