Image Details
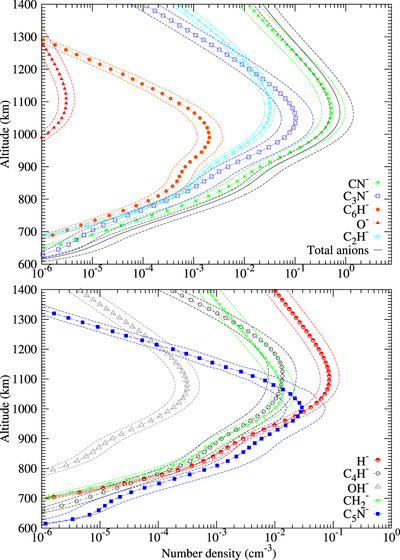
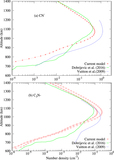
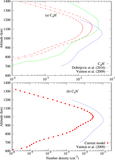
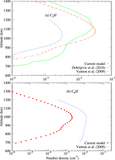
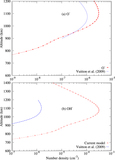
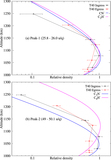
Caption: Figure 8.
The maximum and minimum limits of the ion profiles obtained using the lower and upper limits of the rate coefficients of major production and loss reactions. See the text for more details.
Other Images in This Article
Copyright and Terms & Conditions
© 2018. The American Astronomical Society. All rights reserved.
Copyright ©
2025 Astronomy Image Explorer. All Rights Reserved.