Image Details
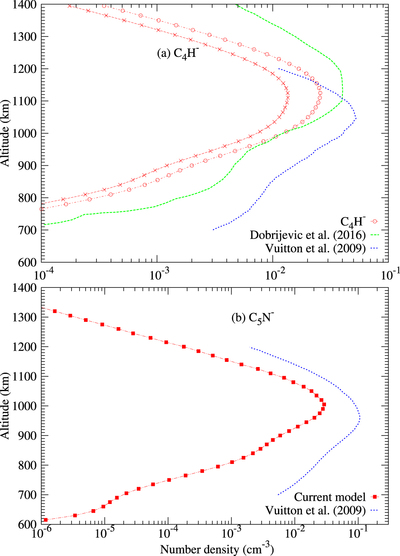
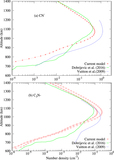
Caption: Figure 5.
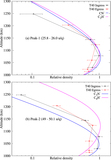
Density profiles of (a) C4H− and (b) C5N− calculated using the current model compared with the calculations of Vuitton et al. (2009) and Dobrijevic et al. (2016). In the top panel, the symbols connected by the solid line show the profile of C3N− obtained when electron density was reduced by half to nullify the effect of overestimation in the electron density. See the text for more details.
Other Images in This Article
Copyright and Terms & Conditions
© 2018. The American Astronomical Society. All rights reserved.
Copyright ©
2025 Astronomy Image Explorer. All Rights Reserved.