Image Details
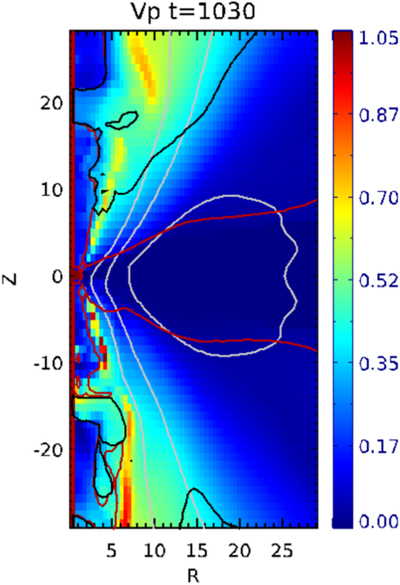
Caption: Figure 21.
Toy model dynamo simulation Dt122. Shown is the poloidal velocity distribution (color plot) with poloidal magnetic field (gray lines) at time t = 1030 just after the second switch-on of the dynamo. We also show the sonic surface (red line) and the fast magnetosonic surface (black line). This is a zoom of the innermost part of the whole computational domain.
Other Images in This Article
Show More
Copyright and Terms & Conditions
© 2018. The American Astronomical Society. All rights reserved.
Copyright ©
2025 Astronomy Image Explorer. All Rights Reserved.