Image Details
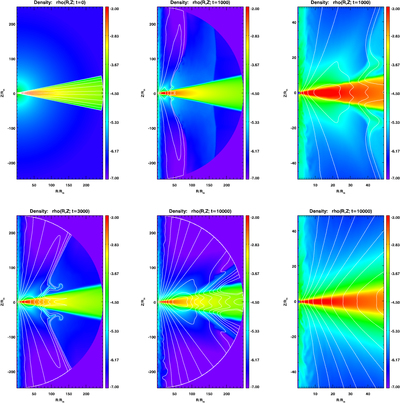
Caption: Figure 1.
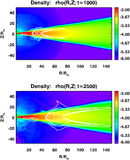
Time evolution of the disk-jet structure of the reference dynamo simulation Dt54. Shown are simulation steps for t = 0 (initial condition), t = 1000, 3000, and 5000 on the full numerial grid (r < 200, z < 200) and a subset of the full grid (r < 50, z < 50). The density is shown in colors (log scale) superimposed by contours of the vector potential and the magnetic flux surfaces. Levels of 0.01, 0.02, 0.035, 0.05, 0.075, 0.1, 0.125, 0.15, 0.175, 0.2, 0.25, 0.3, 0.4, and 0.9 are drawn, but note that the contour levels change between t = 0 and t = 5000 due to the generation of magnetic flux by the disk dynamo.
Other Images in This Article
Show More
Copyright and Terms & Conditions
© 2018. The American Astronomical Society. All rights reserved.