Image Details
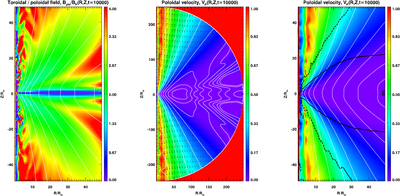
Caption: Figure 2.
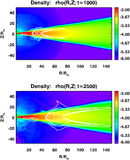
Time evolution of the disk-jet structure of the reference dynamo simulation Dt54. Shown is a simulation step at t = 10,000 on the full numerical grid (r < 200, z < 200) and a subset of the full grid (r < 50, z < 50). We plot the ratio of the toroidal over the poloidal magnetic field (left) and the poloidal velocity (full grid, middle; subgrid right). Superimposed are contours of the vector potential (white lines), velocity vectors (black arrows), the Alfvén surface (black solid line), and the fast magnetosonic surface (black dashed line).
Other Images in This Article
Show More
Copyright and Terms & Conditions
© 2018. The American Astronomical Society. All rights reserved.
Copyright ©
2025 Astronomy Image Explorer. All Rights Reserved.