Image Details
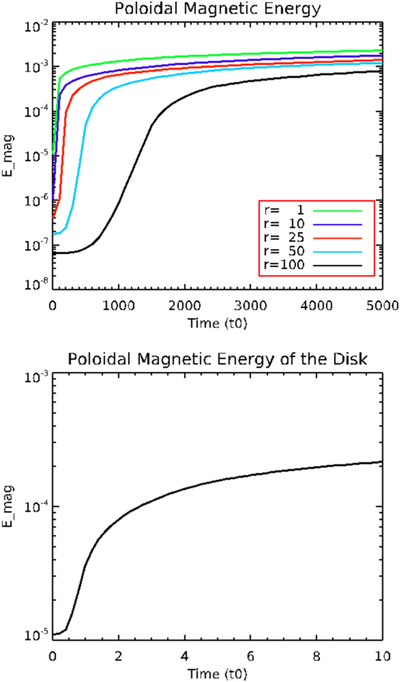
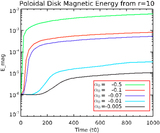
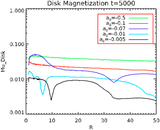
Caption: Figure 7.
Time evolution of the disk poloidal magnetic energy for the reference simulation Dt54 up to t = 5000. Shown is the disk magnetic energy as generated by the disk dynamo in the long term (top), and with higher time resolution for the initial period (bottom). This latter curve is identical to the green curve in the upper panel.
Other Images in This Article
Show More
Copyright and Terms & Conditions
© 2018. The American Astronomical Society. All rights reserved.
Copyright ©
2025 Astronomy Image Explorer. All Rights Reserved.