Image Details
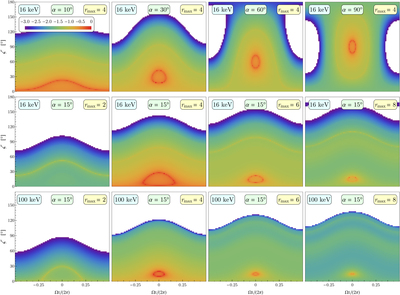
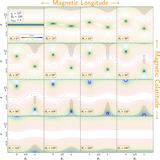
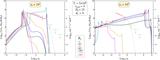
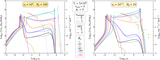
Caption: Figure 12.
Normalized photon flux ﹩\zeta -{\rm{\Omega }}t/2\pi ﹩ phase space maps for resonant Compton upscattering. These represent the logarithmically scaled (base-10) intensity at energies ﹩16﹩ keV (top two rows) and ﹩100﹩ keV (bottom row), color-coded as in the legend, as a function of spin phase ﹩{\rm{\Omega }}t/2\pi ﹩ for each value of ﹩\zeta ﹩ on the ordinate. The intensity maps are for uncooled electrons with ﹩{\gamma }_{e}={10}^{2}﹩ and a uniform surface temperature ﹩T=5\times \ {10}^{6}﹩ K. The maps are obtained for azimuthally integrated bundles of field lines, i.e., a toroidal surface, with ﹩{B}_{p}=10﹩ and ﹩{r}_{\max }=4﹩. The panels in the top row sequentially sample magnetic inclinations ﹩\alpha =10^\circ ,30^\circ ,60^\circ ,90^\circ ﹩, clearly presenting the trend with rotator obliquity. The bottom two rows are for a single magnetic inclination angle of ﹩\alpha =15^\circ ﹩ and depict maps for maximum loop altitudes ﹩{r}_{\max }=2,4,6,8﹩, as indicated, for the two different emergent photon energies. Pulse profiles for a particular observer ﹩\zeta ﹩ are represented by horizontal cuts of the maps. Accordingly, symmetric double-peak structure of pulse profiles in domains ﹩\zeta \approx \alpha ﹩ is readily apparent, being manifested as sections of the red rings: these are realized when quasi-polar viewing is possible at select phases. The phase separation of the double-peak structure of pulse profiles in domains ﹩\alpha \approx \zeta ﹩ shrinks at higher ﹩{r}_{\max }﹩ and larger ﹩{\varepsilon }_{f}﹩. The normalization across all panels in a row is relative to the brightest flux realized in that row.
Other Images in This Article
Show More
Copyright and Terms & Conditions
© 2018. The American Astronomical Society. All rights reserved.