Image Details
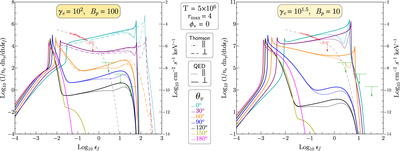
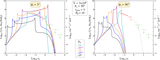
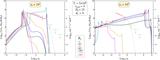
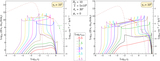
Caption: Figure 9.
Spectra IV: meridional field loops at ﹩{\gamma }_{e}={10}^{2}﹩ (left) and ﹩{\gamma }_{e}={10}^{1.5}﹩ (right) as a function of viewing angle, both with ﹩{r}_{\max }=4﹩ but differing in local ﹩{\boldsymbol{B}}﹩. Solid curves represent spectra computed with the full Sokolov & Ternov (ST) cross section in QED, i.e., Equation (25); dashed (﹩\perp ﹩ mode) and dot-dashed (﹩\parallel ﹩ mode) curves in the left panel define spectra determined using the magnetic Thomson cross section instead (see text). The left panel has relatively high local field at the resonant interaction point, since ﹩{B}_{p}=100﹩, while the right panel illustrates the same parameters as those in Figure 8 but with ﹩{\gamma }_{e}={10}^{1.5}﹩. It is apparent that polarization ﹩\perp ﹩ (solid curves) exceeds ﹩\parallel ﹩ (dotted curves) in the 0.05–1 MeV hard X-ray band for most viewing angles where head-on resonant interactions are sampled.
Other Images in This Article
Show More
Copyright and Terms & Conditions
© 2018. The American Astronomical Society. All rights reserved.