Image Details
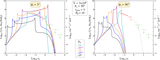
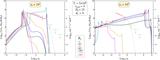
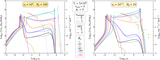
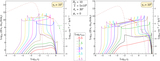
Caption: Figure 6.
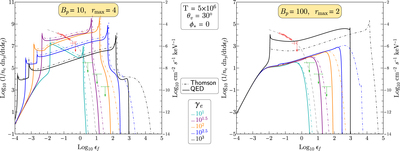
Spectra I: meridional field loops. Both the left and right panels illustrate spectra computed for meridional ﹩{\phi }_{* }=0﹩ field loops for a viewing angle of ﹩{\theta }_{v}=30^\circ ﹩ with fixed Lorentz factors in the range of ﹩{\gamma }_{e}={10}^{1}\mbox{--}{10}^{3}﹩. Solid curves represent spectra computed with the full ST cross section in QED, i.e., Equation (25); lighter-weight dot-dashed curves define spectra determined using elastic kinematics and the magnetic Thomson cross section instead (see text). The left panel illustrates higher-altitude and lower-field directed spectra computed for ﹩{B}_{p}=10﹩ and ﹩{r}_{\max }=4﹩, where the resonant interactions are readily sampled for Lorentz factors ﹩\gt {10}^{2}﹩. The right panel’s local B is much higher, by a factor of ∼80, with ﹩{r}_{\max }=2﹩ and ﹩{B}_{p}=100﹩, so resonant interactions near equatorial regions for the given stellar temperature are not realized unless Lorentz factors are much higher. Overlaid on the computed spectra, with arbitrary normalization, are observational data points for AXP 4U 0142+61 (den Hartog et al. 2008b) along with a schematic ﹩{\varepsilon }_{f}^{-1/2}﹩ power law with a ﹩250﹩ keV exponential cutoff (gray dashed curve).
Other Images in This Article
Show More
Copyright and Terms & Conditions
© 2018. The American Astronomical Society. All rights reserved.