Image Details
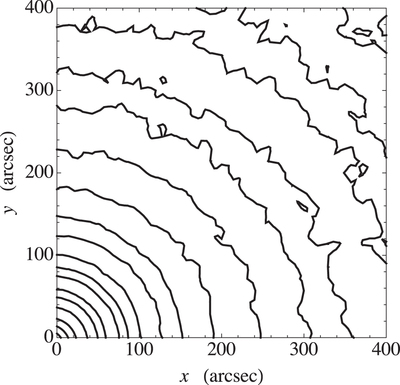
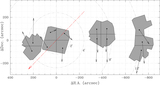
Caption: Figure 11.
Projected isodensity contours for the discrete realization of the best-fit axisymmetric model. The contours are calculated in the first quadrant of the projection plane and correspond to selected values of the projected number density (normalized to the central value) in the range ﹩[0.9,{10}^{-3}]﹩. The area represented in the figure covers a square of side length approximately equal to ﹩2\times {r}_{{\rm{h}}}﹩.
Other Images in This Article
Show More
Copyright and Terms & Conditions
© 2017. The American Astronomical Society. All rights reserved.
Copyright ©
2025 Astronomy Image Explorer. All Rights Reserved.