Image Details
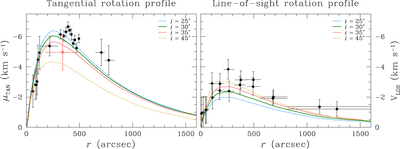
Caption: Figure 6.
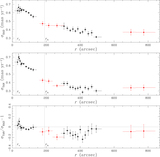
Rotation profiles in the plane of the sky (from this work, expressed here in km s−1 by assuming a cluster distance of 4.5 kpc) and along the LOS (from Bianchini et al. 2013), compared to the fits of the axisymmetric rotating models to all the available kinematic and photometric data. (The best-fit model provides an inclination angle i = 30°.) The red point in the left panel refers to the measurement of Anderson & King (2003a). The two profiles are shown here in a similar representation, for clarity: the ﹩{V}_{\mathrm{LOS}}﹩ profile was folded under the assumption of antisymmetry with respect to the cluster. Blue, green, and red lines indicate models with inclination angles of i = 25°, 30°, and 35°, respectively. The yellow line indicates the model obtained by Bianchini et al. (2013) assuming an inclination angle of i = 45°, clearly unable to reproduce the PM rotation profile. Our new model is able to much better reproduce simultaneously the three-dimensional rotation pattern of 47 Tuc.
Other Images in This Article
Show More
Copyright and Terms & Conditions
© 2017. The American Astronomical Society. All rights reserved.