Image Details
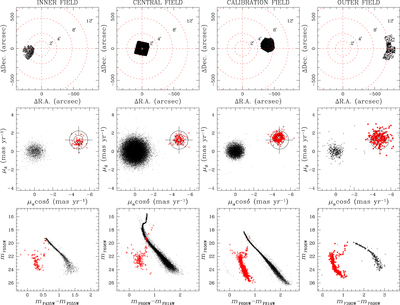
Caption: Figure 2.
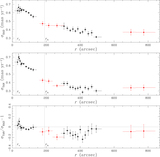
From left to right: the inner field, the central field, the calibration field, and the outer field. From top to bottom, for each field: the field of view, the PM diagram, and the CMD. SMC stars are highlighted in red in both the PM diagrams and the CMDs. Concentric circles in the top panels, in red, give an idea of the radial extension of the data. The crosshairs in each of the PM diagrams are centered on the barycenter of SMC stars in the central field. We can already see that SMC stars in the inner field (to the east side of the cluster’s center) have preferentially lower ﹩{\mu }_{\delta }﹩ values, while the opposite happens to the fields on the west side of the cluster’s center. This is a clear sign of rotation. Moreover, we can see that, while the PM distribution of 47 Tuc stars is circular in the central field, it is flatter in the inner and calibration fields; this is a clear sign of anisotropy. See the text for more details.
Other Images in This Article
Show More
Copyright and Terms & Conditions
© 2017. The American Astronomical Society. All rights reserved.