Image Details
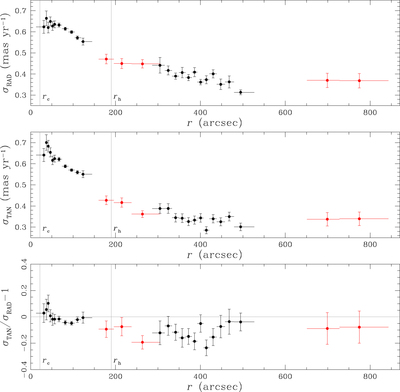
Caption: Figure 5.
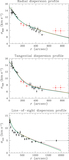
Top panel: radial velocity dispersion profile ﹩{\sigma }_{\mathrm{RAD}}﹩ of MS stars in 47 Tuc as a function of distance from the cluster center. For completeness, we also show in red the values computed using WFPC2 data, for which systematic effects cannot be quantified. Middle panel: tangential velocity dispersion profile for the same stars in the same radial bins. Bottom panel: deviation from isotropy (gray horizontal line). These profiles are based on MS stars in the magnitude range ﹩20\lt {m}_{{\rm{F}}606{\rm{W}}}\lt 22﹩, corresponding to a mass range between 0.62 and 0.47 M⊙. Core and half-light radii (Harris 1996 values) are marked by the two vertical lines in all panels.
Other Images in This Article
Show More
Copyright and Terms & Conditions
© 2017. The American Astronomical Society. All rights reserved.