Image Details
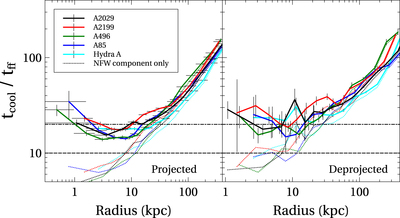
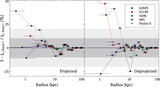
Caption: Figure 9.
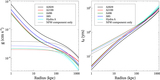
Projected (left) and deprojected (right) tcool/tff profiles for our evaluation sample. Dotted lines on both panels show the equivalent parameters if the isothermal mass component associated with the BCG is neglected. Horizontal error bars in the left panel reflect bin width. The same bin widths are used in the right panel but are not shown. Minimum values of tcool/tff lie in the range 14.8–21.8 for our deprojected profiles.
Other Images in This Article
Copyright and Terms & Conditions
© 2017. The American Astronomical Society. All rights reserved.
Copyright ©
2025 Astronomy Image Explorer. All Rights Reserved.