Image Details
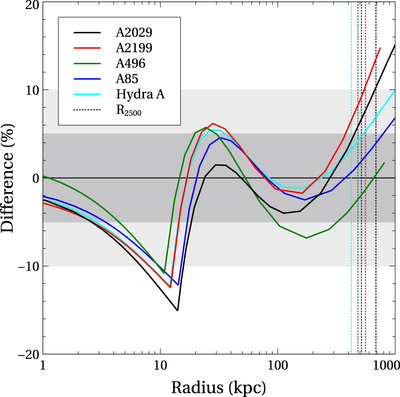
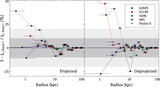
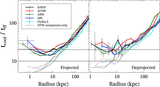
Caption: Figure 7.
Percentage difference (see Equation (9)) in mass between our ISONFWMASS profiles and a singular NFW fit where a constant mass equivalent to the isothermal component at 10 kpc is accounted for in fitting. The vertical dotted lines correspond to the R2500 for each color-coded cluster. We see that systematic differences in the resultant mass profiles are ≲10% out to at least R2500, beyond which the fits diverge. The sharp transition at r ≈ 10 kpc is due to the artificial truncation of the isothermal component in the singular NFW fit. For a full description see Section 4.5.2.
Other Images in This Article
Copyright and Terms & Conditions
© 2017. The American Astronomical Society. All rights reserved.
Copyright ©
2025 Astronomy Image Explorer. All Rights Reserved.