Image Details
Caption: Figure 2.
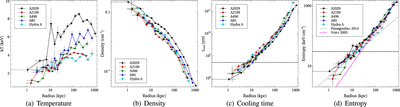
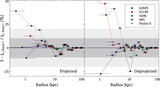
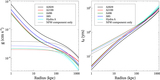
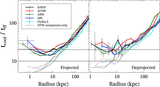
Fully deprojected temperature, density, cooling time (tcool), and entropy profiles. The dotted horizontal lines in panels (c) and (d) show the thresholds for cooling time of 5 × 10⁸ yr and for entropy of 30 keV cm2, respectively. Note that all sources satisfy both thresholds, as was the case for the projected profiles (see Figure 1). In panel (d) we show the overall best fitting power-law model to the inner entropy profiles of a sample of 66 nearby clusters presented by Panagoulia et al. (2014) and a standard cluster entropy profile with scaling K ∝ r1.1 as expected from gravity alone (e.g., Tozzi & Norman 2001; Voit et al. 2005). Note that the normalization of this latter power law is adjusted to match our profiles.
Other Images in This Article
Copyright and Terms & Conditions
© 2017. The American Astronomical Society. All rights reserved.