Image Details
Caption: Figure 1.
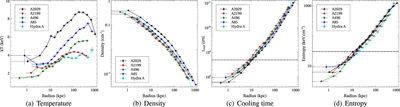
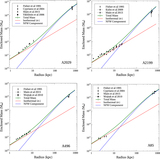
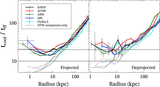
Projected temperature, density, cooling time (tcool), and entropy profiles. The dotted horizontal lines in panels (c) and (d) show the thresholds for cooling time of 5 × 10⁸ yr and for entropy of 30 keV cm2, respectively. Note that all sources satisfy both thresholds (see Section 3.1). Regardless of this and unlike the other four sources shown here, A2029 does not display nebular emission indicative of ongoing cooling.
Other Images in This Article
Copyright and Terms & Conditions
© 2017. The American Astronomical Society. All rights reserved.
Copyright ©
2025 Astronomy Image Explorer. All Rights Reserved.