Image Details
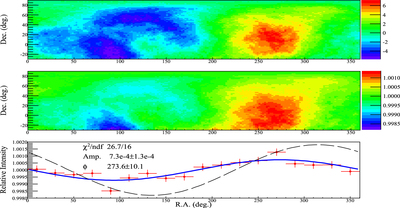
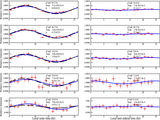
Caption: Figure 3.
Large-scale sidereal anisotropy at 300 TeV by the Tibet AS Array. The 2D maps are smoothed with a 30° Gaussian kernel. The top and middle panels display the significance and relative intensity maps, respectively, while the bottom one shows the 1D projection of the 2D map onto the R.A. axis. The blue curve shows the first harmonic fitting to the data, and the black dashed line is the predicted Galactic CG effect with an amplitude of ∼0.19%.
Other Images in This Article
Copyright and Terms & Conditions
© 2017. The American Astronomical Society. All rights reserved.
Copyright ©
2026 Astronomy Image Explorer. All Rights Reserved.