Image Details
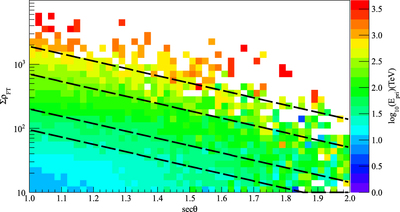
Caption: Figure 1.
Simulated distribution of the log-mean energy of primary CRs as a function of ﹩\sum {\rho }_{\mathrm{FT}}﹩ and zenith angle. The y-axis is ﹩\sum {\rho }_{\mathrm{FT}}﹩; the x-axis is sec θ, where θ is the reconstructed zenith angle; and the color scale represents the reconstructed log-mean energy in units of TeV. Dashed lines mark out the borders of events with different energies (15, 50, 100, 300, and 1000 TeV).
Other Images in This Article
Copyright and Terms & Conditions
© 2017. The American Astronomical Society. All rights reserved.
Copyright ©
2026 Astronomy Image Explorer. All Rights Reserved.