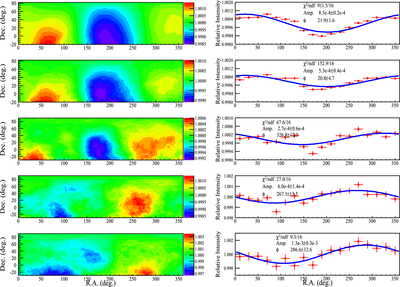
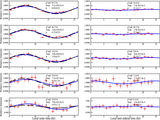
Image Details

Choose export citation format:

Northern Sky Galactic Cosmic Ray Anisotropy between 10 and 1000 TeV with the Tibet Air Shower Array

  • Authors: M. Amenomori, X. J. Bi, D. Chen, T. L. Chen, W. Y. Chen, S. W. Cui, Danzengluobu, L. K. Ding, C. F. Feng, Zhaoyang Feng, Z. Y. Feng, Q. B. Gou, Y. Q. Guo, H. H. He, Z. T. He, K. Hibino, N. Hotta, Haibing Hu, H. B. Hu, J. Huang, H. Y. Jia, L. Jiang, F. Kajino, K. Kasahara, Y. Katayose, C. Kato, K. Kawata, M. Kozai, Labaciren, G. M. Le, A. F. Li, H. J. Li, W. J. Li, C. Liu, J. S. Liu, M. Y. Liu, H. Lu, X. R. Meng, T. Miyazaki, K. Mizutani, K. Munakata, T. Nakajima, Y. Nakamura, H. Nanjo, M. Nishizawa, T. Niwa, M. Ohnishi, I. Ohta, S. Ozawa, X. L. Qian, X. B. Qu, T. Saito, T. Y. Saito, M. Sakata, T. K. Sako, J. Shao, M. Shibata, A. Shiomi, T. Shirai, H. Sugimoto, M. Takita, Y. H. Tan, N. Tateyama, S. Torii, H. Tsuchiya, S. Udo, H. Wang, H. R. Wu, L. Xue, Y. Yamamoto, K. Yamauchi, Z. Yang, A. F. Yuan, T. Yuda, L. M. Zhai, H. M. Zhang, J. L. Zhang, X. Y. Zhang, Y. Zhang, Yi Zhang, Ying Zhang, Zhaxisangzhu, and X. X. Zhou

2017 The Astrophysical Journal 836 153.

  • Provider: AAS Journals

Caption: Figure 4.

2D anisotropy maps in five energy samples (15, 50, 100, 300, and 1000 TeV, from top to bottom). Left panels show the relative intensity maps (with 30° smoothing), while right panels show the 1D projections. The meaning of the blue curves in the right panels is the same as in Figure 3.

Other Images in This Article
Copyright and Terms & Conditions