Image Details
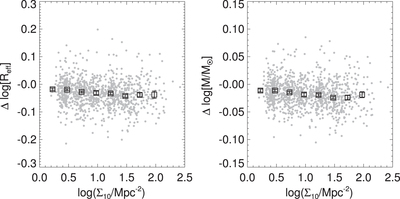
Caption: Figure 9.
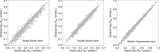
We tested how neighboring sources affect the size and total flux measurement. This figure indicates differences of the measured size (left) and stellar mass (right) as a function of environment, in which the differences are between two simulated cases (with/without all sources in the environment). Negative values mean underestimated ones for the case with all sources in the environment. The black squares are median values in each environment bin. The error bar of each square is 1σ of the median values from 200 bootstrap resampling.
Other Images in This Article


Show More
Copyright and Terms & Conditions
© 2017. The American Astronomical Society. All rights reserved.
Copyright ©
2025 Astronomy Image Explorer. All Rights Reserved.