Image Details
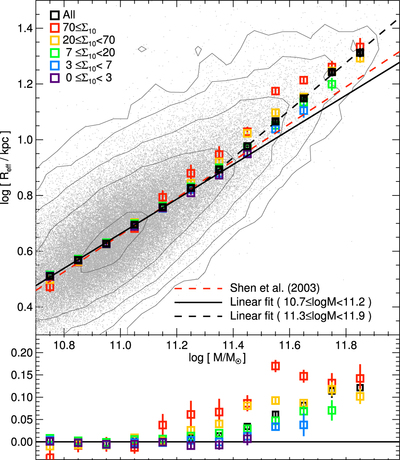
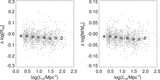
Caption: Figure 10.
Mass–size relation of the galaxies with ﹩\mathrm{log}({M}_{\star }/{M}_{\odot })\gt 10.7﹩. The gray dots in the background denote each galaxy. Contour lines indicate the same density of the gray points and are plotted in a logarithmic scale. The black squares are median effective radii of all galaxies in each mass bin. The size of the mass bin is 0.1 dex. The colored squares are median effective radii of the galaxies under different environments as described in Section 3.1. The error bar of each square point is 1σ of the median effective radii from 200 bootstrap resampling. The solid black line is the best-fit mass–size relation for galaxies at ﹩10.7\leqslant \mathrm{log}({M}_{\star }/{M}_{\odot })\lt 11.2﹩, and it is extrapolated to ﹩\mathrm{log}({M}_{\star }/{M}_{\odot })\gt 11.2﹩ for demonstration purposes. Differences between all squares and the linear fit line are shown in the bottom subpanel. The dashed black line is the best-fit mass–size relation for galaxies at ﹩11.3\leqslant \mathrm{log}({M}_{\star }/{M}_{\odot })\lt 11.9﹩. For comparison, the linear mass–size relation from Shen et al. (2003, Figure 6) is shown as a red dashed line.
Other Images in This Article


Show More
Copyright and Terms & Conditions
© 2017. The American Astronomical Society. All rights reserved.