Image Details
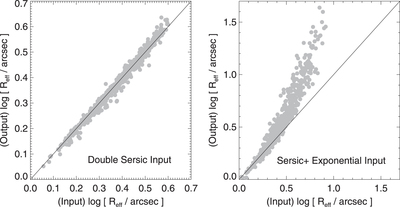
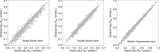
Caption: Figure 8.
Comparison between input sizes of simulated galaxies and their sizes measured by the single Sérsic fit. The left panel is for the double Sérsic model, and the right panel is for the Sérsic + exponential model. The lines denote one-to-one relations.
Other Images in This Article


Show More
Copyright and Terms & Conditions
© 2017. The American Astronomical Society. All rights reserved.
Copyright ©
2025 Astronomy Image Explorer. All Rights Reserved.