Image Details
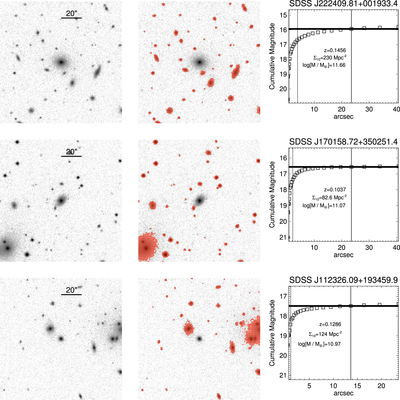
Caption: Figure 3.
Galaxies in the highest-density bin. Middle panels show examples of masking processes applied to images in the left panels. The right panels show examples of the curve of growth for each galaxy. The thick horizontal lines represent the total magnitudes of each galaxy. The vertical dashed lines indicate the effective radii of each galaxy that are seeing corrected by an empirical relation. We showed the radii where total fluxes are measured as the vertical solid lines.
Other Images in This Article


Show More
Copyright and Terms & Conditions
© 2017. The American Astronomical Society. All rights reserved.
Copyright ©
2025 Astronomy Image Explorer. All Rights Reserved.