Image Details
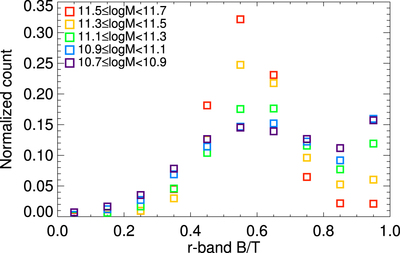
Caption: Figure 22.
r-band B/T distribution of our sample extracted from S11. We divided them by several mass ranges. Each distribution is normalized by the total number of galaxies in each mass range, respectively. The distribution stretches down to B/T ∼ 0.4 even in the most massive regime, but we note that the B/T presented in S11 is not an ideal indicator of “genuine” B/T for all galaxies. In some cases, bulge and disk components are not real bulge and disk, but just a mathematical representation of the surface brightness profiles. See Appendix A for details.
Other Images in This Article


Show More
Copyright and Terms & Conditions
© 2017. The American Astronomical Society. All rights reserved.
Copyright ©
2025 Astronomy Image Explorer. All Rights Reserved.