Image Details
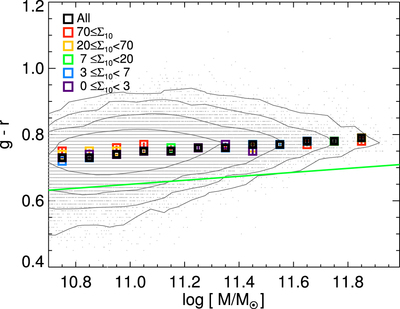
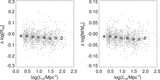
Caption: Figure 20.
Rest-frame g − r color–mass diagram for our sample of early-type galaxies. The squares indicate median values, and the error bar of each square is 1σ of the median values from 200 bootstrap resampling. The green line divides galaxies into red and blue populations as in Bluck et al. (2014). Most of the galaxies are above the green line, indicating that they are red galaxies. Furthermore, their median color values are very similar (0.7–0.8) across the whole mass range in the figure and show negligible environmental dependence.
Other Images in This Article


Show More
Copyright and Terms & Conditions
© 2017. The American Astronomical Society. All rights reserved.
Copyright ©
2025 Astronomy Image Explorer. All Rights Reserved.