Image Details
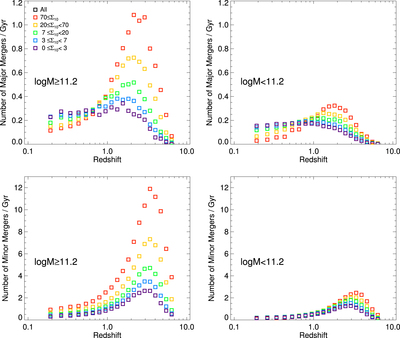
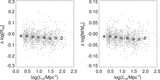
Caption: Figure 16.
Look-back time distributions of major (upper panels) and minor (lower panels) merger events. The distributions for massive galaxies of ﹩\mathrm{log}({M}_{\star }/{M}_{\odot })\geqslant 11.2﹩ are shown in the left panels, while those for less massive galaxies of ﹩\mathrm{log}({M}_{\star }/{M}_{\odot })\lt 11.2﹩ are shown in the right panels. The colored squares are the average number of mergers per gigayear for different environments.
Other Images in This Article


Show More
Copyright and Terms & Conditions
© 2017. The American Astronomical Society. All rights reserved.
Copyright ©
2025 Astronomy Image Explorer. All Rights Reserved.