Image Details
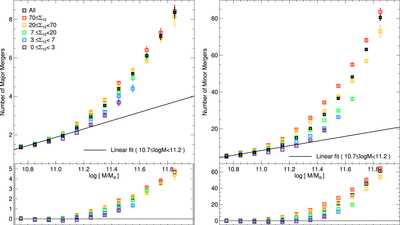
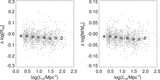
Caption: Figure 14.
Average number of major mergers (left) and minor mergers (right) that the simulated galaxies have undergone, as a function of mass. The black squares indicate all galaxies, while the colored squares denote the galaxies under different environments. The error bar of each square point is 1σ of the average values from 200 bootstrap resampling. The solid black line is the best-fit relation for galaxies at ﹩10.7\leqslant \mathrm{log}({M}_{\star }/{M}_{\odot })\lt 11.2﹩. Differences between all squares and the linear fit line are shown in the bottom subpanel. There is a clear environmental dependence of the merger history in the most mass galaxies of ﹩\mathrm{log}({M}_{\star }/{M}_{\odot })\gtrsim 11.0﹩. Below this mass range, the environmental dependence nearly disappears.
Other Images in This Article


Show More
Copyright and Terms & Conditions
© 2017. The American Astronomical Society. All rights reserved.