Image Details
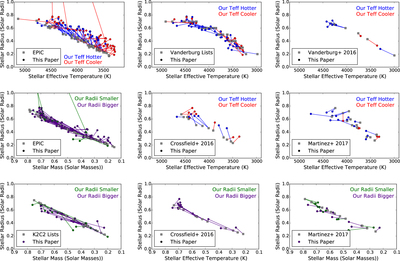
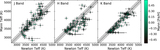
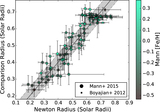
Caption: Figure 13.
Comparison of our revised stellar parameters (circles) to the earlier estimates from other studies (gray squares). Solid lines connect the before and after values for each star. Top left: stellar radius vs. effective temperature comparing values in the EPIC to our updated values. In this panel and in all other radius vs. temperature panels, blue (red) lines connect the initial and revised values for stars for which our new effective temperature estimates are hotter (cooler). Top center: stellar radius vs. stellar effective temperature comparing values in the unpublished planet candidate lists provided by A. Vanderburg to our updated values. Top right: stellar radius vs. stellar effective temperature comparing values in Vanderburg et al. (2016) to our updated values. Middle center: stellar radius vs. stellar effective temperature comparing values in Crossfield et al. (2016) to our updated values. Middle right: stellar radius vs. stellar effective temperature comparing values in Martinez et al. (2017) to our updated values. Bottom left: stellar radius vs. stellar mass comparing values in unpublished K2C2 planet candidate lists to our updated values. Bottom center: stellar radius vs. stellar mass comparing values in Crossfield et al. (2016) to our updated values. Bottom right: stellar radius vs. stellar mass comparing values in Martinez et al. (2017) to our updated values.
Other Images in This Article

Show More
Copyright and Terms & Conditions
© 2017. The American Astronomical Society. All rights reserved.