Image Details
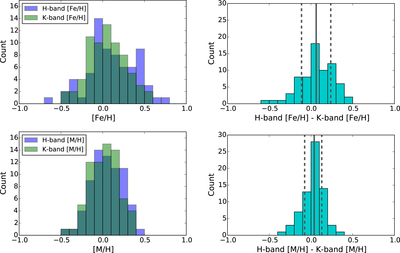
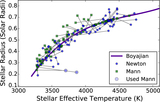
Caption: Figure 8.
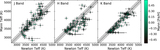
Estimated metallicities for the 63 cool dwarfs with spectral types of K7 or later. The top two panels display the distribution of [Fe/H] (left) and [M/H] (right) calculated using separate relations from Mann et al. (2013a) for H-band (blue) and K-band (green) spectra. The bottom two panels display the distributions of differences in the H-band and K-band estimates of [M/H] (left) and [Fe/H] (right). The green lines indicate the median values (solid lines) and the 16th and 84th percentile values (dashed lines).
Other Images in This Article

Show More
Copyright and Terms & Conditions
© 2017. The American Astronomical Society. All rights reserved.
Copyright ©
2025 Astronomy Image Explorer. All Rights Reserved.