Image Details
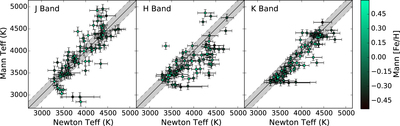
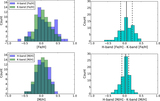
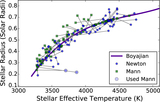
Caption: Figure 5.
Comparison of temperatures derived using EW-based estimates from Newton et al. (2015) and spectral indices from Mann et al. (2013b) in J band (left), H band (middle), and K band (right). Points within the shaded region lie within 150 K of a one-to-one relation (solid line). All points are color-coded by [Fe/H], as indicated by the colorbar.
Other Images in This Article

Show More
Copyright and Terms & Conditions
© 2017. The American Astronomical Society. All rights reserved.
Copyright ©
2025 Astronomy Image Explorer. All Rights Reserved.