Image Details
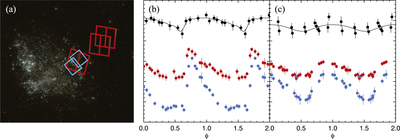
Caption: Figure 6.
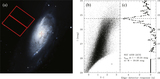
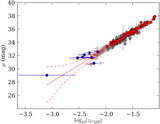
Example Local Group RR Lyrae and TRGB data for IC 1613. (a) Image demonstrating our HST + WFC3–IR RR Lyrae and HST + ACS TRGB observations from the LCID project (inner fields) and our ACS parallel fields in the inner halo of IC 1613 (outer fields). The background image is from GALEX. Example light curves for (b) a type RRab (V039) with a period of 0.520 days and for (c) a type RRc (V130) with period 0.314 days (D. Hatt et al. 2016, in preparation). Sample HST light curves in the optical (﹩F475W﹩, blue, bottom; ﹩F814W﹩, red, middle Bernard et al. 2010), and NIR (﹩F160W﹩, black, top; D. Hatt et al. 2016, in preparation). As a part of this program, we derive new photometry for the literature data, but adopt the period measurements from earlier discovery work. The black line shows the best-fit HST NIR imaging template via Yang & Sarajedini (2012).
Other Images in This Article

Copyright and Terms & Conditions
© 2016. The American Astronomical Society. All rights reserved.