Image Details
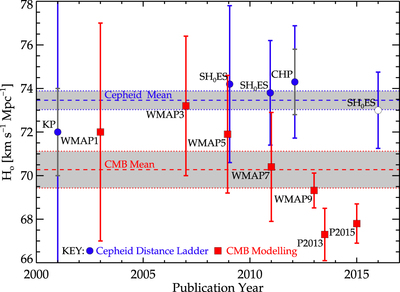
Caption: Figure 1.
Comparison of recent determinations of H0 using the Cepheid distance ladder (blue circles) and CMB modeling techniques (red squares) as a function of publication year, with the recent value from Riess et al. (2016) given as an open circle. Many of the projects shown here have multiple measurements, but effort was taken to choose the measurements that are most comparable; for the Cepheid distance ladder the “preferred value” based on the different anchors is used and for the CMB modeling values are shown using similar input priors on cosmological parameters (see Table 1 for a more exhaustive list of individual and best-estimate values). Colored error bars represent the “total” error (quadrature sum of random and systematic) quoted at the time of publication, with the gray error bars indicating just the random component (but only if it was indicated in the publication; see Table 1). The 1σ range of the mean for the Cepheid distance ladder and CMB modeling are shown as the shaded regions with the mean indicated by a dashed line. These two approaches, which use techniques that are “local” and “cosmological” in nature, respectively, differ by more than 3σ in their unweighted mean values. As demonstrated here, the tension has grown with the accumulating CMB data sets.
Other Images in This Article
Copyright and Terms & Conditions
© 2016. The American Astronomical Society. All rights reserved.