Image Details
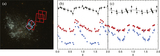
Caption: Figure 3.
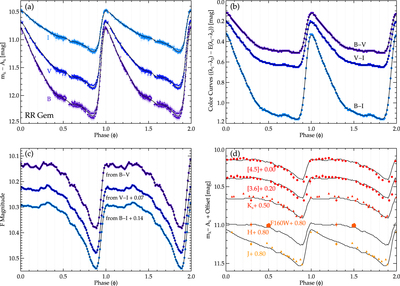
Construction of light-curve templates. (a) Observed optical light curves for RR Gem in B, V, I. (b) Color curves for RR Gem that physically trace the temperature variations over the pulsation cycle. (c) By removing the temperature curves from the initial light curves, the radial variations can be isolated. These radial variations are the only dominant effect seen in the NIR and MIR. (d) NIR and MIR light curve templates generated from the optical data (black lines) with sparsely sampled MIR data overplotted (colored points). For J and Ks we show both the 2MASS data (filled circles) and data from Liu & Janes (1989) (filled triangles). For ﹩F160W﹩ (similar to H), we show all of the individual measurements obtained using our HST observing strategy for this bright star (described in Section 3.1.2). Note the reduced light-curve amplitudes and overall more sinusoidal shape at these wavelengths. Using the templates, we can produce high-quality intensity-weighted mean magnitudes even with only sparsely sampled or single-phase observations.
Other Images in This Article

Copyright and Terms & Conditions
© 2016. The American Astronomical Society. All rights reserved.