Image Details
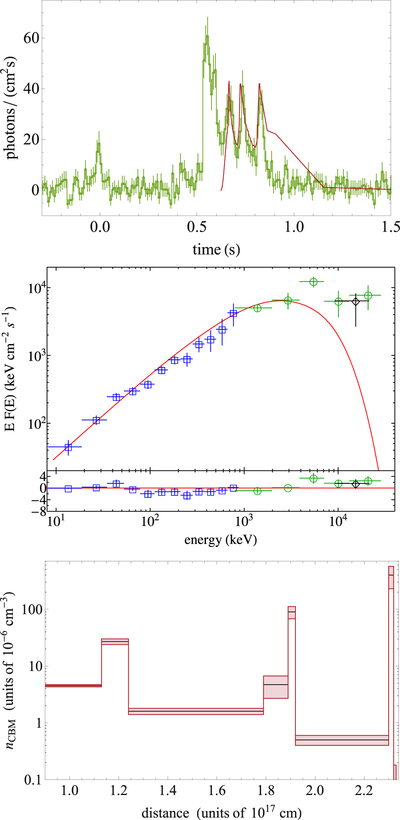
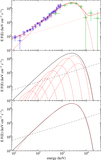
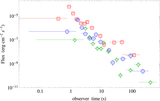
Caption: Figure 9.
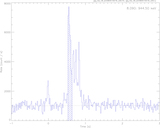
Results of the fireshell simulation of GRB 090510. Top panel: fit of the prompt emission Fermi-GBM NaI-n6 light curve. Middle panel: fit of the corresponding spectrum including the Fermi-NaI-6 (blue squares) and BGO-b1 (green circles) data in the time interval from ﹩{T}_{0}+0.644﹩ to ﹩{T}_{0}+0.864\,{\rm{s}}﹩. A single data point obtained from the Mini-Calorimeter on board AGILE, in the range 10–20 MeV and in the first 0.2 s of the AGILE light curve (from ﹩{T}_{0}+0.5﹩ to ﹩{T}_{0}+0.7\,{\rm{s}}﹩ in the Fermi light curve), is shown for comparison (reproduced from Figure 4 in Giuliani et al. 2010). Bottom panel: density profile of the CBM inferred from the simulation of CBM clouds of ∼1022 g.
Other Images in This Article


Copyright and Terms & Conditions
© 2016. The American Astronomical Society. All rights reserved.