Image Details
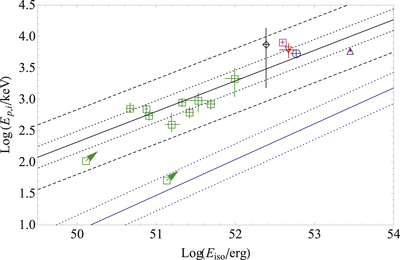
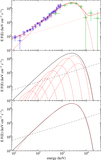
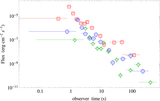
Caption: Figure 6.
﹩{E}_{\mathrm{peak}}\mbox{--}{E}_{\mathrm{iso}}﹩ plot of all short bursts with redshift. The black line marks the relation for S-GRBs (which includes the theoretical redshifts we obtained for four GRBs). This relation takes the form ﹩\mathrm{log}{E}_{\mathrm{peak}}=A+\gamma (\mathrm{log}{E}_{\mathrm{iso}})﹩, where ﹩A=-22.0\pm 3.2﹩, ﹩\gamma =0.49\pm 0.06﹩, and ﹩{E}_{\mathrm{peak}}﹩ and ﹩{E}_{\mathrm{iso}}﹩ are respectively given in keV and erg. The dotted and dashed lines represent the ﹩1\sigma ﹩ and ﹩3\sigma ﹩ scatter of the relation, respectively (﹩{\sigma }_{\mathrm{sc}}=0.17\pm 0.04﹩ dex). Green boxes indicate S-GRFs with a measured redshift; only lower limits are available for the two S-GRFs singled out by an arrow. GRB 090510 is marked by the pink square. The other four symbols indicate S-GRBs with a redshift derived from the fireshell analysis. The black diamond indicates GRB 081024B, the red inverted triangle GRB 140402A, the blue square GRB 140619B, and the purple triangle GRB 090227B. For comparison, the blue line marks the relation for long GRBs given in Calderone et al. (2015), ﹩\mathrm{log}{E}_{\mathrm{peak}}=A+\gamma (\mathrm{log}{E}_{\mathrm{iso}}-B)﹩, where A = 2.73, B = 53.21, and ﹩\gamma =0.57\pm 0.06﹩. The dotted lines represent the ﹩1\sigma ﹩ scatter of the relation (﹩{\sigma }_{\mathrm{sc}}=0.25﹩ dex).
Other Images in This Article


Copyright and Terms & Conditions
© 2016. The American Astronomical Society. All rights reserved.