Image Details
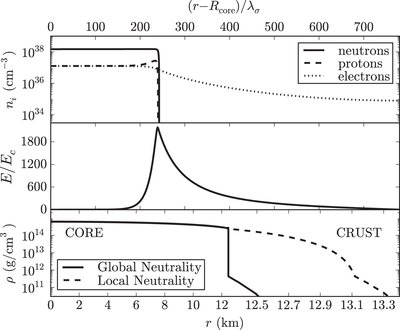
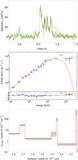
Caption: Figure 2.
Particle density profiles (top panel) and the electric field in units of Ec (middle panel) in the core-crust transition layer normalized to the σ-meson Compton wavelength ﹩{\lambda }_{\sigma }={\hslash }/({m}_{\sigma }c)\sim 0.4﹩ fm. Bottom panel: density profile inside an NS star with central density ﹩\rho \sim 5{\rho }_{\mathrm{nuc}}﹩, where ﹩{\rho }_{\mathrm{nuc}}﹩ is the nuclear density, from the solution of the Tolman–Oppenheimer–Volkoff (TOV) equations (locally neutral case) and the globally neutral solution presented in Belvedere et al. (2012). The density at the edge of the crust is the neutron drip density ﹩{\rho }_{\mathrm{drip}}=4.3\times {10}^{11}﹩ g cm﹩{}^{3}﹩. This figure is reproduced from Belvedere et al. (2012), with their kind permission.
Other Images in This Article


Copyright and Terms & Conditions
© 2016. The American Astronomical Society. All rights reserved.