Image Details
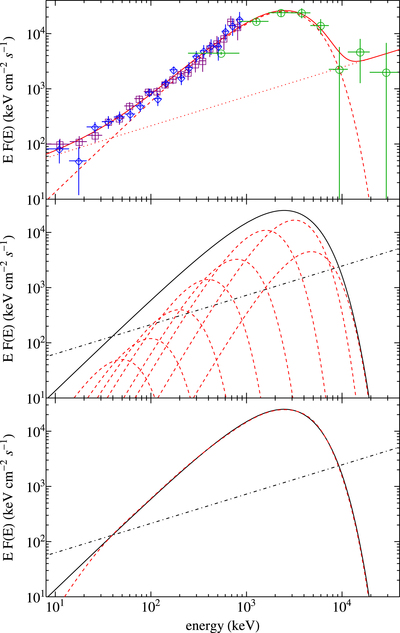
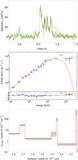
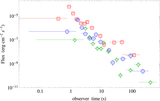
Caption: Figure 8.
Top panel: P-GRB spectrum of GRB 090510 from the Fermi-GBM NaI-n6 (purple squares) and n7 (blue diamonds) and the BGO-b1 (green circles) detectors, in the time interval from ﹩{T}_{0}+0.528﹩ to ﹩{T}_{0}+0.644\,{\rm{s}}﹩. The best fit (solid red line) is composed of a power-law model (dotted red line) and a Comptonized model (dashed red curve). Middle panel: above Comptonized model (here the solid black line), viewed as a convolution of thermal components (dashed red curves). The convolution of blackbodies produces the result plotted in the bottom panel, namely, a dashed red curve reproducing the Comptonized model. The power-law component (dot-dashed black line in the middle and bottom panels) is very likely related to a mildly jetted component necessary to fulfill the conservation of the energy and angular momentum of the system.
Other Images in This Article


Copyright and Terms & Conditions
© 2016. The American Astronomical Society. All rights reserved.