Image Details
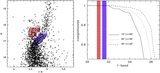
Caption: Figure 8.
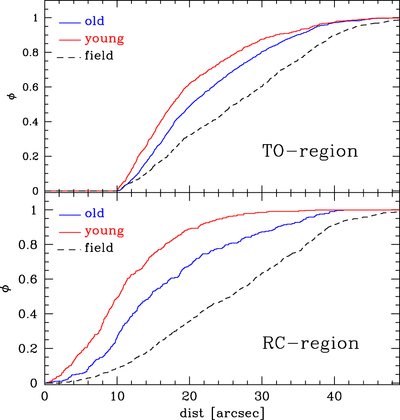
Top panel: cumulative radial distribution of MS-TO/SGB stars belonging to the young population (red line) and to the old population (blue line), compared to that of field stars (black dashed line), as a function of the projected distance from the center of Terzan 5. The samples of MS-TO/SGB stars have been selected on the basis of the (K, I–K) CMD as shown in Figure 7. In order to avoid incompleteness biases, only stars at r > 10″ from the center have been considered. The field distribution has been obtained from a synthetic sample of 10,000 stars uniformly distributed over the considered observed region. Bottom panel: the same as in the top panel, but for stars selected from the two red clumps with no radial selection. Clearly, the young population is more centrally concentrated than the old one.
Other Images in This Article
Copyright and Terms & Conditions
© 2016. The American Astronomical Society. All rights reserved.