Image Details
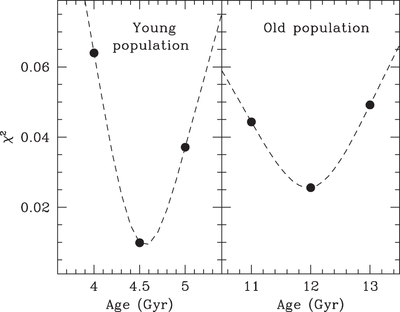
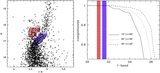
Caption: Figure 5.
Isochrone fitting. The value of the χ2 parameter (see the text for its definition) is plotted as a function of the age of the three isochrones selected to reproduce the young and the old populations (see Figure 3). In both cases, a well-defined minimum identifies the best-fit isochrone.
Other Images in This Article

Copyright and Terms & Conditions
© 2016. The American Astronomical Society. All rights reserved.
Copyright ©
2025 Astronomy Image Explorer. All Rights Reserved.