Image Details
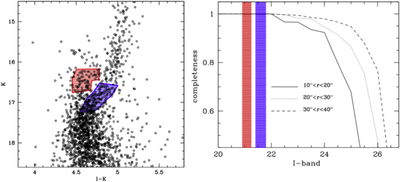
Caption: Figure 7.
Population selection and completeness analysis for the cumulative radial distribution study. Top panel: the boxes adopted to select stars along the MS-TO/SGB sequences of the old (blue shaded region) and young (red shaded region) populations. All the stars with r > 10″ lying within the two selection boxes have been considered to construct the radial distributions shown in the upper panel of Figure 8. Bottom panel: the completeness curves in the I band obtained in radial annuli at different distances from the center (see labels). The two vertical strips mark the I-band magnitude ranges (20.9 < I < 21.35 in red, and 21.4 < I < 21.8 in blue) covered by the boxes adopted to select, respectively, the young and the old populations used to study the cumulative radial distributions.
Other Images in This Article

Copyright and Terms & Conditions
© 2016. The American Astronomical Society. All rights reserved.