Image Details
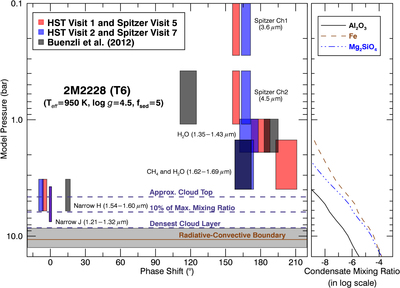
Caption: Figure 19.
Left panel: phase shifts between light curves of six spectral bands of 2M2228 (T6) plotted as a function of characteristic pressure levels probed by the bandpasses. The phase shifts are all with respect to that of the narrow J band. The size of a rectangle in the horizontal direction marks the 1σ range of the phase shift for a narrow bandpass, and the size of a rectangle in the vertical direction marks the pressure region in the model where between 20% and 80% of the total flux comes from for a narrow bandpass. The solid brown horizontal line is the radiative-convective boudary in the atmospheric model, and the gray band marks the size of the particular model pressure grid. The three dashed horizontal lines represent the pressure levels where the condensate volume mixing ratio is at 100%, 10%, and 1% of the maxmimum value, respectively. Right panel: condensate volume mixing ratio in the model plotted as a function of model pressure.
Other Images in This Article
Show More
Copyright and Terms & Conditions
© 2016. The American Astronomical Society. All rights reserved.