Image Details
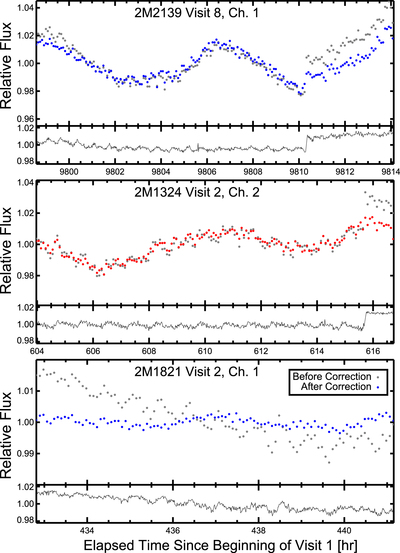
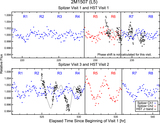
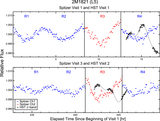
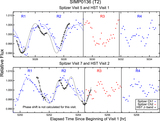
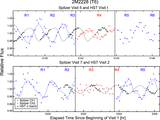
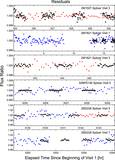
Caption: Figure 3.
Three example light curves showing the correction for the intrapixel sensitivity variations in the Spitzer observations. In each major panel, the gray dots are the extracted raw photometric points, while the red and blue dots show the corrected data after dividing out the best-fit quadratic correction functions. The corrections are able to remove sudden flux discontinuities and zigzag-shaped flux changes caused by the intrapixel sensitivity variations. The minor panels display the best-fit quadractic correction functions for the specific visits. Note the different flux scales for the data and the quadractic correction function. The light curves are binned in 5-minute intervals.
Other Images in This Article
Show More
Copyright and Terms & Conditions
© 2016. The American Astronomical Society. All rights reserved.