Image Details
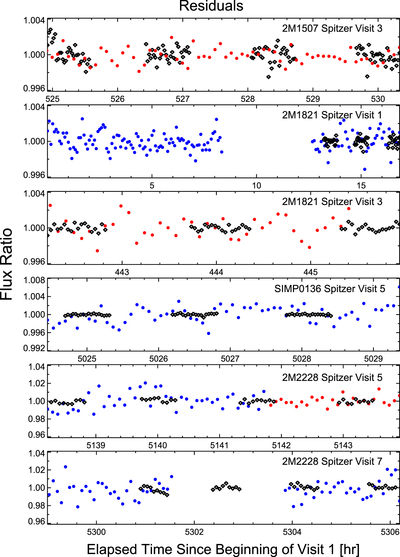
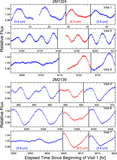
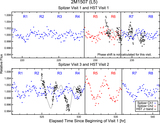
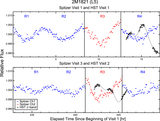
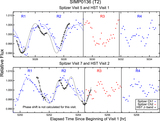
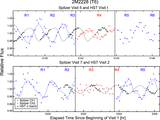
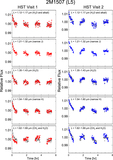
Caption: Figure 9.
Light-curve residuals from the Fourier fits. The blue and red dots represent residuals for the Spitzer Ch1 and Ch2 light curves, respectively. The black open diamonds are HST J-band residuals.
Other Images in This Article
Show More
Copyright and Terms & Conditions
© 2016. The American Astronomical Society. All rights reserved.
Copyright ©
2025 Astronomy Image Explorer. All Rights Reserved.