Image Details
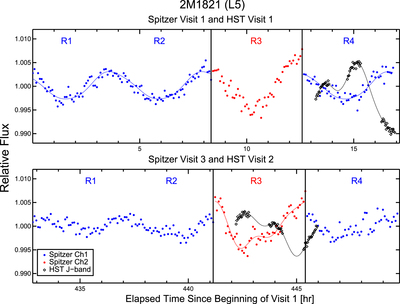
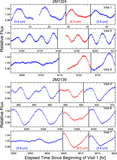
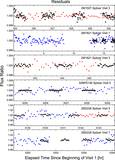
Caption: Figure 6.
Simultaneous HST J-band and Spitzer light curves of 2M1821. The black solid curves are Fourier fits to the HST J-band light curves. The blue and red solid curves are Fourier fits to the Spitzer Ch1 and Ch2 light curves, respectively. The amplitude of the J-band light curve is decreased by a factor of 1.5 for display purposes.
Other Images in This Article
Show More
Copyright and Terms & Conditions
© 2016. The American Astronomical Society. All rights reserved.
Copyright ©
2025 Astronomy Image Explorer. All Rights Reserved.